Data Solutions and Visualizations
Data Solutions and Visualizations
Turning Data into Impact for Ohio
Ohio's comprehensive interactive source for health data
Using platforms like R Shiny and Tableau, the GRC builds public‑facing and restricted‑access dashboards that support strategic planning, quality improvement, and policy development. These tools power initiatives such as the Ohio Pregnancy Assessment Survey (OPAS), the state’s most comprehensive interactive source for maternal and infant health data.
Our team also provides geospatial analysis and mapping to help partners understand geographic patterns, identify service gaps, and visualize community health statuses. This work strengthens measure development, supports equity‑focused research, and guides data‑driven decisions.
Behind these visuals is a strong data engineering foundation. The GRC integrates multiple datasets, builds secure data environments, and creates user‑friendly analytic solutions tailored to the needs of state agencies and medical partners.
From dashboards to predictive analytics, the GRC equips decision‑makers with tools that are intuitive, reliable, and designed to help Ohio’s leaders see their data clearly and use it with confidence.
Dashboards
GRC’s expert staff enhance research projects by creating interactive data dashboards that provide users with informative, easy to understand visualizations of policy-relevant data and information. The examples highlighted below utilize publicly available data. GRC also constructs dashboards in a HIPAA compliant environment with sensitive data, including PHI, that are password protected and can only be viewed by approved users.
-
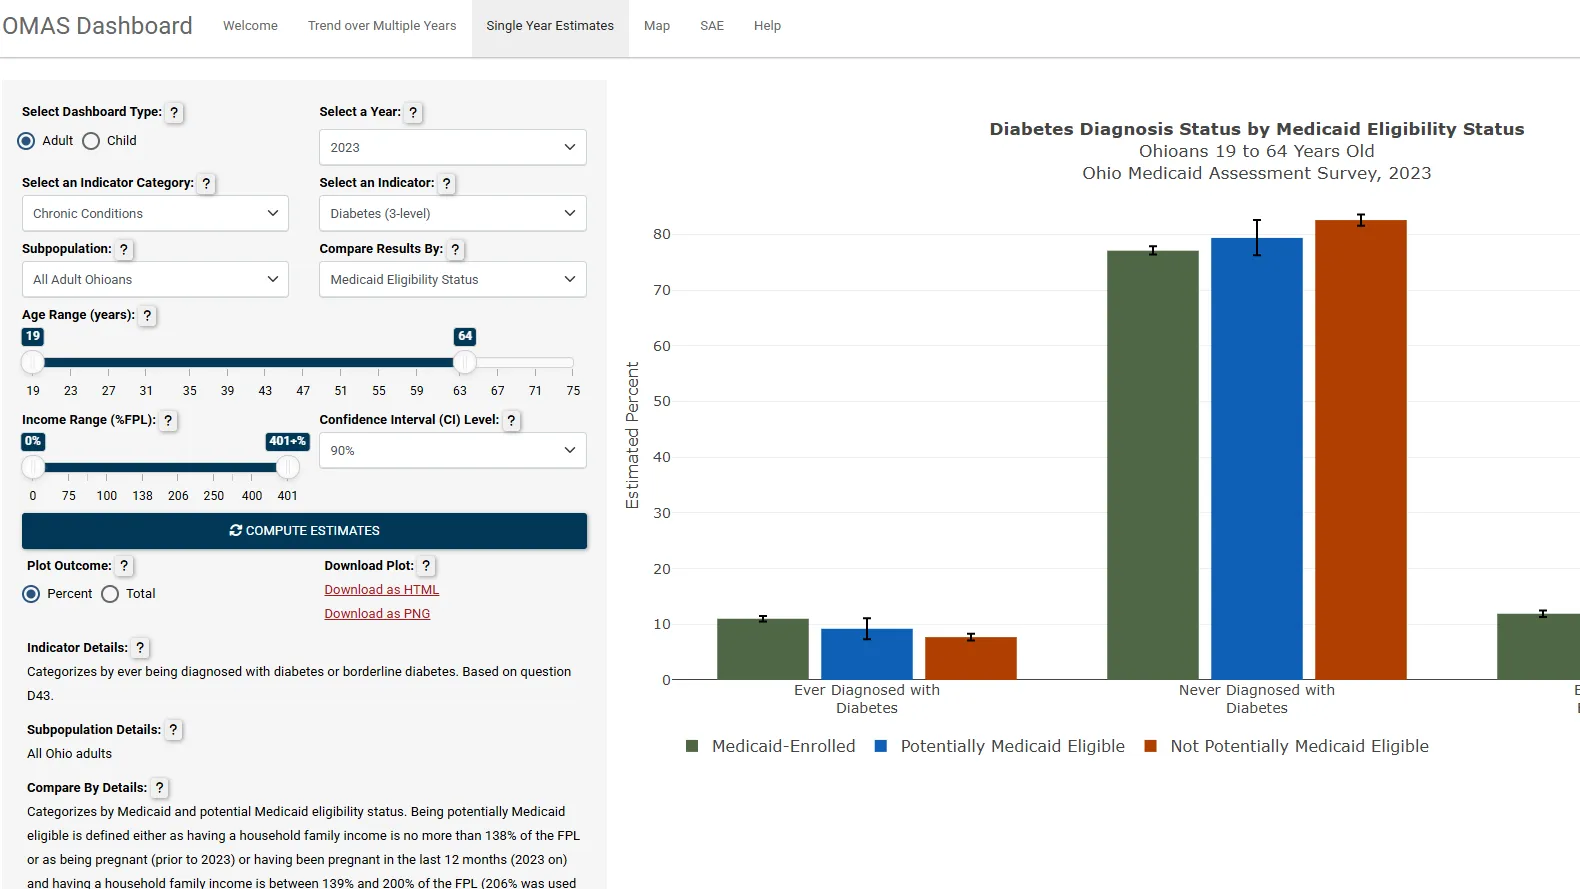
Ohio Medicaid Assessment Survey
The OMAS is a multi-mode random probability survey that delivers health and healthcare data and gives insight into the health status of Ohio’s Medicaid, Medicaid-eligible, and non-Medicaid populations. The OMAS Dashboard include data from 2010 - 2023, provide current snapshots of Ohio’s healthcare landscape, examine trends over time, and compare key populations. These tools provide fast, real-time results. You can direct how the survey data are analyzed without performing any programming and can build and download custom extracts of the OMAS results.
-
The Ohio Pregnancy Assessment Survey Series Dashboard
The OPAS is a statewide, ongoing, targeted population-based survey that utilizes the Centers for Disease Control and Prevention (CDC) Pregnancy Risk Assessment Monitoring System (PRAMS) methodology to collect information and attitudes on Ohio residents who had a live birth in Ohio. The OPAS Dashboard allows you to obtain a data-driven view of maternal and infant health (MIH) in Ohio. Without knowing any programming or statistical techniques, you can analyze OPAS data, examining trends and comparing key population groups. The OPAS Series is administered by the Ohio Department of Health (ODH) and Ohio Department of Medicaid (ODM) with the assistance of the Ohio Colleges of Medicine Government Resource Center (GRC).